- Integrated Planning
Integrated Planning
Integrated planning is a sustainable approach to planning that builds relationships, aligns the organization, and emphasizes preparedness for change.
- Topics
Topics
- Resources
Resources
Featured Formats
Popular Topics
- Events & Programs
Events & Programs
Upcoming Events
- Community
Community
The SCUP community opens a whole world of integrated planning resources, connections, and expertise.
 Planning for Higher Education Journal
An Analysis of Instructional Expenditures in U.S. Public Higher Education
From 2004 Through 2015 From Volume 47 Number 3 | April–June 2019By Dawn Iwamasa, Michael ThrasherPlanning Types: Resource Planning
Due to the rising price of tuition, the prevailing narrative regarding higher education is that the cost of delivering a college degree is increasing substantially. However, the cost of delivering an education is not definitively linked to the price in tuition paid to attend. Prior studies confirmed small increases in instructional expenditures per full-time-equivalent student from the 1980s to 2000; however, more recent trends in instructional costs are relatively unknown. The purpose of this study was to track instructional expenditures from 2004 to 2015 at U.S. public two-year and four-year institutions, and to calculate those expenditures as a proportion of U.S. Gross Domestic Product.
DOWNLOADThe economics of higher education encompass an array of complex, interrelated elements. Certain aspects, such as fixed expenses, economic impact, and overall affordability, may offer opportunities for objective measurement and tracking. Conversely, education also provides benefits that are less quantifiable, including the intangible returns of education on society in general or on an individual’s life and career fulfillment. In recent years, much of the conversation about higher education economics has focused on the rising price of college tuition. Many authors have stated that the cost of education has grown substantially over the years, with various data supporting those assertions. However, terminology may be used inconsistently at times, and confusion arises when discussing and comparing the price of tuition, the cost of delivering an education, or both.
In recent years, much of the conversation about higher education economics has focused on the rising price of college tuition.
The terms “cost” and “price” are often used interchangeably in the related literature. However, the National Commission on the Costs of Higher Education (NCCHE), established in 1997 to examine the rising costs in higher education, makes a distinction between cost and price (Harvey et al. 1998). Cost may be defined as the expenses incurred by the institution, while price refers to the amount students are required to pay to attend (Harvey et al. 1998). Although the price of tuition is often associated with the cost of delivering a college degree, the two are not unequivocally linked (Brinkman 2000), because students generally do not pay the full costs of their education (Harvey et al., 1998; McPherson and Shulenburger 2010; Wellman, Desrochers, and Lenihan 2008).
Over the past several decades, the price of tuition has markedly risen. NCCHE found that tuition prices from 1980 to 1995 nearly doubled, even after controlling for inflation (Harvey et al. 1998). The Delta Cost Project at the American Institutes for Research, an independent non-partisan research group, compiled data from 1997 to 2005 and found that revenue from tuition increases outpaced revenue from other sources (Wellman, Desrochers, and Lenihan 2008). More recently, the National Center for Education Statistics (2018) reported that from 2005 to 2016, the price of tuition, fees, room, and board, adjusted for inflation, increased 34 percent at public institutions and 26 percent at non-profit institutions, but decreased 16 percent at private for-profit institutions.
While data indicate that the price that students pay for education has increased considerably in recent decades, more uncertainty surrounds recent trends in unit cost, or the cost per student, of delivering a college education. Studies investigating expenditures per student have often focused on specific outcomes, such as student engagement (Pike, Kuh, McCormick, Ethington, and Smart 2011; Pike, Smart, Kuh, and Hayek 2006; Ryan 2005), learning outcomes (Pike et al. 2011), degree attainment (Ryan 2004), graduation and persistence rates (Webber and Ehrenberg 2010), and leadership abilities (Smart et al. 2002). Few authors have systematically examined the actual institutional costs of delivering instruction to a given population of students.
There is no single, prevailing method for accurately calculating instructional cost per student. Time-series studies evaluating average cost per student have utilized various formulas. A rudimentary approach, such as simply dividing the total of all institutional expenditures by the number of enrolled students, yields one potential data source. However, such an approach may be misleading due to various factors. Differences in institutional structure, the demographics of the student body, and the inclusion of complex research, health care, or auxiliary budgets may complicate the simplest formulas (Bowen 1980). Efforts to parse institutional budgets into instructional, research, auxiliary, health care, and other components may yield greater insights into the actual cost of delivering instructional units.
The Integrated Postsecondary Education Data System (IPEDS) collects and publishes data on a range of educational statistics, including expenditures in higher education. Several studies have used IPEDS data to examine expenditures per student. Getz and Siegfried (1991) compared expenditures per full-time equivalent (FTE) student in two-year and four-year institutions from 1978 and 1987. Using an adjusted education and general formula (AE&G), they found that the costs per student increased faster than the rate of inflation (Getz and Siegfried 1991). In a similar study, Harter, Wade, and Watkins (2005) used Getz and Siegfried’s AE&G formula to examine expenditures per student at four-year public colleges and universities, and found the AE&G per FTE grew at an annual rate of 2.13 percent between 1989 and 1998.
While studies have indicated increases in instructional costs over time, other studies have suggested the rate of increase is not relative to the price of tuition increase. An NCCHE report found that from 1987 to 1996, the rate of tuition increase surpassed the rate of increase for instructional costs (Harvey et al. 1998). Additionally, the Delta Cost Project concluded that between 1998 and 2005, the percent change in net tuition revenue per FTE far surpassed the percent change in total education and general spending per FTE (Wellman, Desrochers, and Lenihan 2008). McPherson and Shulenburger (2010) also concluded that among public research universities, educational costs were largely contained between 1987–2005, while state appropriations per student declined.
Another perspective for comparing spending over time is to calculate expenditures as a portion of Gross Domestic Product (GDP), which is often used to measure the size and health of a country’s economy and indicates the total value of goods and services during a given year (U.S. Department of Commerce, Bureau of Economic Analysis n.d.). Subsequently, percentage of total GDP spending is often used as an indication of the proportion of the economy spent for a given sector. The Organization for Economic Cooperation and Development estimates that the United States spent 2.7 percent of its GDP on higher education expenditures in 2014, with 0.9 percent from government sources (U.S. Department of Education, National Center for Education Statistics 2018). Historically, higher education government expenditures in the United States were 1 percent of GDP in 2005 and 1.1 percent of GDP in 2010, 2011, and 2012 (U.S. Department of Education, National Center for Education Statistics 2018).
Due to the rising price of tuition, the prevailing narrative regarding higher education is that the cost of delivering a college degree is increasing substantially. However, that may present an incomplete depiction of the prevailing nuances and intricacies of the actual instructional expenditures (IE) of American higher education. Additional data may reveal patterns in higher education expenditures that have not been systematically analyzed. The purpose of the present study was to examine the IE of public higher education in a longitudinal manner, with emphasis on instructional spending per student (both enrolled and FTE). In addition, the study explored the relationship between IE and American GDP over the same time period.
Method
Primary material and data for the study originated from three sources: The National Center for Education Statistics (NCES); the Federal Reserve Economic Data (FRED) system, a database maintained by the Research Division of the Federal Reserve Bank of St. Louis; and the Bureau of Labor Statistics of the United States Department of Labor. Through annual reporting, NCES tracks various data about the functions and operations of the higher education system, including overall expenditures. Summation tables produced by NCES disaggregates institutional expenditures into the following categories:
- Instruction (including salaries and wages)
- Research
- Public Service
- Academic Support
- Student Services
- Institutional Support
- Operation and Maintenance of Plant
- Depreciation
- Scholarships and Fellowships
- Auxiliary Enterprises
- Hospitals
- Independent Operations
- Interest
- Other Expenditures
Because the study sought expenditure data incontrovertibly linked to the delivery of instruction, the authors chose to examine only selected categories of expenditures. Getz and Siegfried (1991) and Harter et al. (2005) used instruction, public service, academic support, student services, institutional support, operation and maintenance of plant, mandatory transfers, and unrestricted expenditures on scholarships and fellowships in their AE&G formula. However, due to changes in government accounting standards in 2000 and IPEDS reporting (T. Snyder, pers. comm., July 12, 2018), it was not possible to replicate the AE&G formula used in prior studies. The authors of the present study instead chose to include the following expenditure categories:
- Instruction (including Salaries and Wages)
- Academic Support
- Student Services
- Institutional Support
- Operation and Maintenance of Plant
- Scholarships and Fellowships
- Interest
- Other Expenditures
The formula (which did not consider costs associated with research, public service,
depreciation, auxiliary enterprises, hospitals, or independent operations) yielded a single annual number labeled as “Instructional Expenditures.” IE were limited to public institutions in the United States, and were further disaggregated into subsections for four-year, two-year, and all public institutions.
To compare the data to national gross domestic product trends, the authors sourced United States GDP data from the FRED system, which links with the U.S. Bureau of Economic Analysis (n.d.). GDP data were reported as non-seasonally adjusted numbers in current dollar valuations. For measuring purposes, IE numbers were compared with reported national GDP on January 1 of the academic year under analysis (e.g., IE for 2011–2012 were calculated in comparison to national GDP on January 1, 2012). That yielded an indication of total IE as a percentage of GDP during the time period under analysis.
Finally, to determine total IE per enrolled student, total enrollment data were derived from NCES. Division of expenditures by number of enrolled students (disaggregated by two-year, four-year, and all institutions) yielded a discrete data point for each academic year. A similar approach was used for calculating IE per FTE student. The authors used the same formula used in prior studies to calculate FTE student enrollment by adding the number of full-time students with one-third of the number of part-time students (Harter, Wade, and Watkins 2005; Ryan, 2004; Ryan 2005). For comparison purposes, expenditure amounts were adjusted for inflation using the Consumer Price Index calculator from the Bureau of Labor Statistics (n.d.), with January 1 of each academic year serving as the reporting date.
Results
NCES data from 2004–2015 indicated that, in terms of constant 2015 (inflation-adjusted) dollars, IE in public institutions of higher education increased from approximately $167.6 billion during 2004-2005 to over $211 billion during 2014–2015 (Figure 1). During the same period, IE at two-year institutions increased from approximately $42 billion to $48.8 billion, and IE at four-year institutions increased from approximately $125.4 billion to $162.3 billion. Overall expenditures increased during the time period; however, there was modest contraction in 2011–2012, and general stagnation between 2009–2012 (in the wake of the 2007–2009 U.S. Great Recession). Two-year institutions experienced more severe contractions during that time period, with IE in 2014–2015 falling short of the numbers in 2009–2010. Four-year institutions observed steadier and more persistent increases, although the rate generally slowed after the Great Recession. Figure 2 illustrates those data, with the period of the recession indicated by the shaded area.
Figure 1 IE at U.S. Public Higher Education Institutions in Constant 2015 (Inflation-Adjusted) Dollars (2004-2015)
Year Total IE (Thousands)
Percent Change 2-Year IE (Thousands)
Percent Change 4-Year IE (Thousands)
Percent Change 2004-2005 $167,580,300 $42,146,920 $125,433,380 2005-2006 $170,805,290 1.92% $42,485,650 0.80% $128,319,640 2.30% 2006-2007 $176,209,690 3.16% $44,072,920 3.74% $132,136,780 2.97% 2007-2008 $185,632,540 5.35% $45,081,710 2.29% $140,550,820 6.37% 2008-2009 $192,264,830 3.57% $47,167,990 4.63% $145,097,950 3.24% 2009-2010 $193,226,990 0.50% $49,691,870 5.35% $143,535,120 -1.08% 2010-2011 $200,727,190 3.88% $51,833,600 4.31% $148,893,590 3.73% 2011-2012 $199,268,300 -0.73% $50,014,010 -3.51% $149,254,290 0.24% 2012-2013 $199,614,070 0.17% $48,979,210 -2.07% $150,634,860 0.92% 2013-2014 $204,495,120 2.45% $48,356,760 -1.27% $156,138,370 3.65% 2014-2015 $211,082,380 3.22% $48,814,271 0.95% $162,268,109 3.93% Figure 2. IE at U.S. Public Higher Education as a Percentage of U.S. Gross Domestic Product (U.S. Recession Indicated in the Shaded Area)
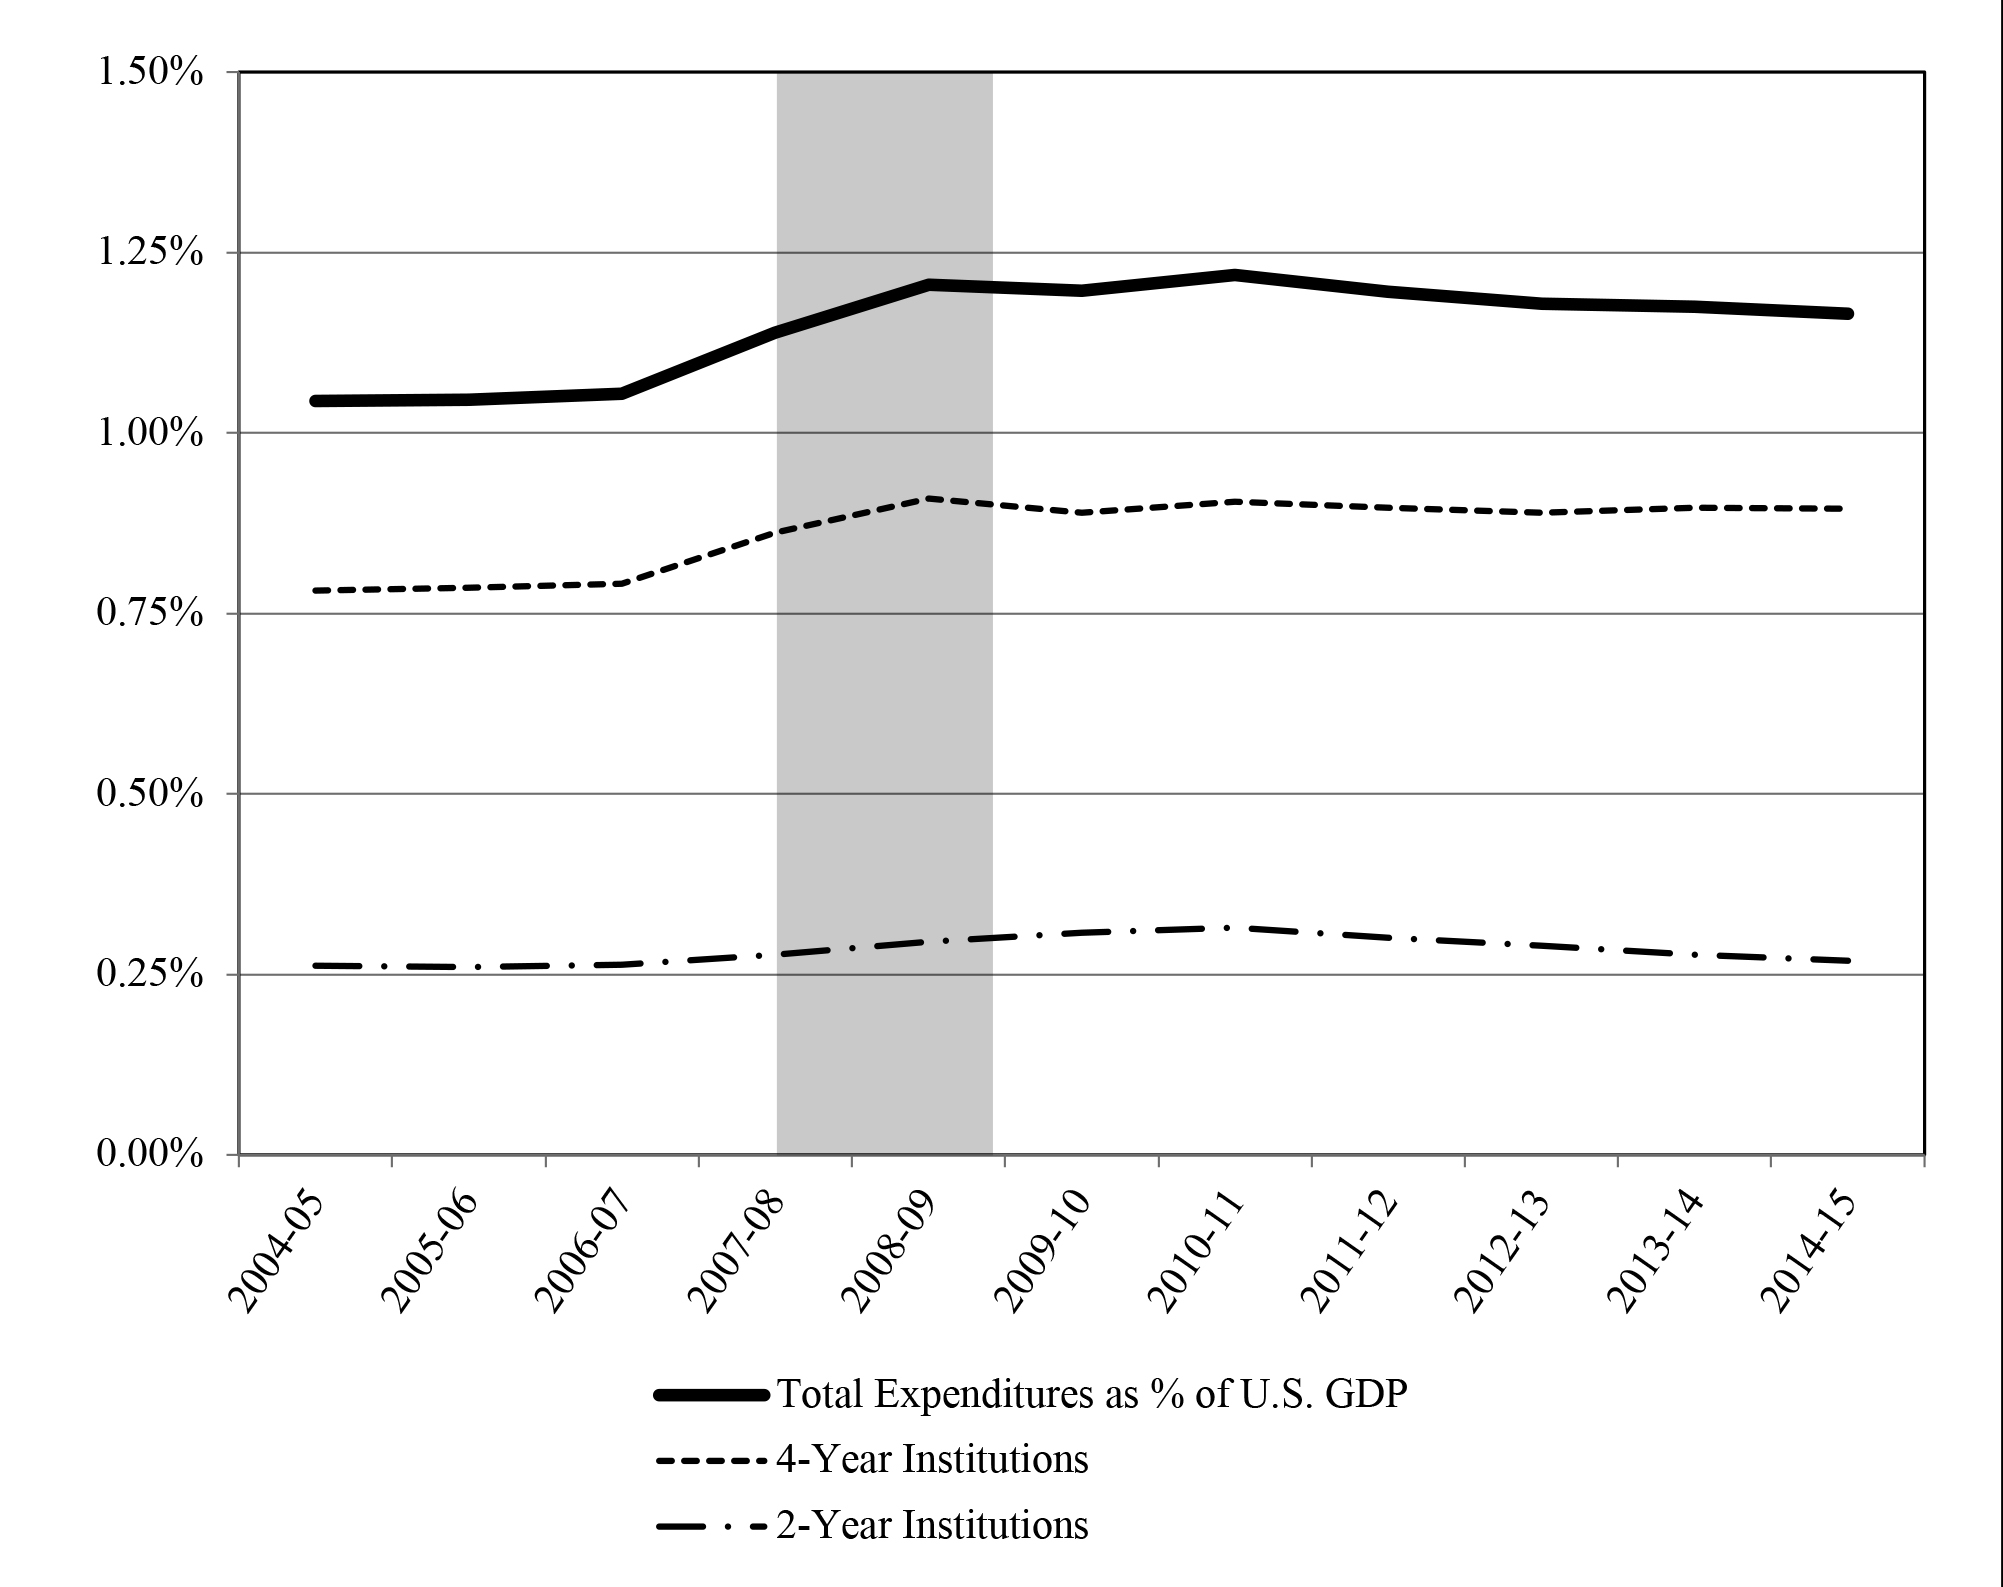
Figure 3 presents the IE of public institutions in relation to U.S. GDP. During the period under review, IE at all institutions increased from 1.04 percent to 1.16 percent of GDP. A bump in percentage occurred during 2008–2012 (as national GDP experienced contraction due to the recessionary period), before contracting from 2012–2015. Two-year and four-year institutions observed the same overall pattern; however, two-year institutions experienced a much flatter trend line, with proportional IE during 2014–2015 (0.27 percent) almost equivalent to IE during 2004–2005 (0.26 percent). Four-year institutions observed a more substantial proportional increase (from 0.78 percent to 0.90 percent).
In considering IE per enrolled student at public institutions, overall expenditures increased from $12,911 per student during 2004–2005 to $14,403 per student during 2014–2015 (a total increase of 11.6 percent) (Figure 4). Substantive increases did not materialize until late in the period under review, with expenditures during 2013–2014 roughly equivalent to expenditures during 2007–2008. IE at two-year and four-year institutions observed similar patterns; in particular, two-year schools saw expenditures remain relatively steady through most of the period.
Figure 3 IE at U.S. Public Higher Education as a Percentage of U.S. Gross Domestic Product
Year Total IE as a Percentage of GPD 2-Year IE as a Percentage of GPD 4-Year IE as a Percentage of GPD 2004-2005 1.04% 0.26% 0.78% 2005-2006 1.05% 0.26% 0.79% 2006-2007 1.05% 0.26% 0.79% 2007-2008 1.14% 0.28% 0.86% 2008-2009 1.20% 0.30% 0.91% 2009-2010 1.20% 0.31% 0.89% 2010-2011 1.22% 0.31% 0.90% 2011-2012 1.20% 0.30% 0.90% 2012-2013 1.18% 0.29% 0.89% 2013-2014 1.17% 0.28% 0.90% 2014-2015 1.16% 0.27% 0.90% Figure 4 Instructional Expenditures Per Enrolled Student at U.S. Public Higher Education Institutions in Constant 2015 (Inflation-Adjusted) Dollars
Year IE Per Enrolled Student at All Institutions Percent Change IE Per Enrolled Student at 2-Year Institutions Percent Change IE Per Enrolled Student at 4-Year Institutions Percent Change 2004-2005 $12,911 $6,750 $18,620 2005-2006 $13,117 1.60% $6,870 1.77% $18,767 0.79% 2006-2007 $13,369 1.93% $7,080 3.05% $18,999 1.24% 2007-2008 $13,760 2.92% $7,129 0.69% $19,612 3.23% 2008-2009 $13,761 0.00% $7,103 -0.35% $19,790 0.91% 2009-2010 $13,046 -5.19% $6,997 -1.49% $18,619 -5.92% 2010-2011 $13,256 1.61% $7,181 2.63% $18,790 0.92% 2011-2012 $13,182 -0.56% $7,082 -1.38% $18,546 -1.30% 2012-2013 $13,411 1.73% $7,211 1.83% $18,614 0.37% 2013-2014 $13,867 3.40% $7,298 1.20% $19,228 3.30% 2014-2015 $14,403 3.87% $7,630 4.56% $19,652 2.21% Figure 5 (Figure 5) examines IE per full-time equivalent student, utilizing the formula previously described. Total expenditures increased from $18,137 per FTE student during 2004–2005 to $20,136 per FTE student during 2014–2015 (a total increase of 11 percent). Again, much of the increase appeared late in the period, with most years observing modest increases or mild contraction. Corresponding patterns appeared in two-year and four-year institutions. Figures 4 and 5 present those data graphically.
Figure 5 IE Per FTE Student at U.S. Public Higher Education Institutions in Constant 2015 (Inflation-Adjusted) Dollars
Year IE Per FTE Student at All Institutions Percent Change IE Per FTE Student at 2-Year Institutions Percent Change IE Per FTE Student at 4-Year Institutions Percent Change 2004-2005 $18,137 $11,396 $22,636 2005-2006 $18,406 1.48% $11,631 2.06% $22,804 0.74% 2006-2007 $18,765 1.95% $12,010 3.26% $23,097 1.28% 2007-2008 $19,293 2.81% $12,066 0.47% $23,881 3.39% 2008-2009 $19,339 0.24% $12,056 -0.08% $24,065 0.77% 2009-2010 $18,188 -5.95% $11,590 -3.87% $22,653 -5.87% 2010-2011 $18,432 1.34% $11,849 2.23% $22,851 0.87% 2011-2012 $18,427 -0.03% $11,893 0.37% $22,585 -1.16% 2012-2013 $18,752 1.76% $12,222 2.77% $22,695 0.49% 2013-2014 $19,364 3.26% $12,408 1.52% $23,432 3.25% 2014-2015 $20,136 3.99% $13,113 5.68% $24,003 2.44% Discussion
Based on the data analyzed, IE at U.S. public institutions increased during 2004–2015, in terms of constant 2015 (inflation-adjusted) dollars. However, evidence suggested that the increases were more modest and perhaps less consistent than may be commonly known. For most of the period, total IE per enrolled student hovered between $13,100 and $13,800. In terms of FTE students, the data indicated similar patterns, with IE during 2012–2013 less than during 2006–2007. That indicated that the actual costs of delivering higher education instruction may not have increased as radically as prevailing narratives suggested.
Considering IE as a proportion of national GDP yielded another distinct perspective to the economics of higher education. Total IE percentages during that period increased from 1.04 percent to 1.16 percent of GDP. Within the period, the proportion remained relatively constant from 2007 (1.14 percent) to 2014 (1.16 percent). An overall increase was more noticeable among four-year institutions, while two-year schools remained remarkably flat. Consequently, the relative percentage of overall economic capacity that had been devoted to higher education was not indicative of massive and abrupt increases.
Such observations tended to contradict the perception of huge escalations in the price of higher education. While price (in the sense of expenses that students are required to pay) has increased substantially, the overall cost of education (as described by IE) has not closely paralleled that trend line. For comparison purposes, Figure 6 presents the inflation-adjusted rate of change in tuition, fees, and IE for the different educational categories. During the period under review, tuition and fees increased at a much higher pace than did IE, and substantive differences were evident when examining the type of institution. At two-year institutions, tuition and fees nearly doubled (29 percent) the increase in IE (13 percent for per-enrolled student and 15 percent per FTE). A more dramatic upsurge was noticed for four-year institutions, with tuition and fees more than six times the increase in IE (38 percent increase compared to 6 percent increase in IE).
Figure 6 Rate of Change (Inflation-Adjusted) from 2004 to 2015
All Institutions 2-Year Institiutions 4-Year Institutions Tuition and Fees 42% 29% 38% IE per Enrolled Student 12% 13% 6% IE per FTE 11% 15% 6% The price of tuition is often thought of as relating to the cost of delivering an education. Policy makers and the public often think that the rising price in tuition must mean that the cost of education is also increasing at the same rate. The results of the present study indicated that IE are not rising at the same rate as tuition prices, thus the cost of education is progressively being passed on to the student in tuition increases (McPherson and Shulenburger 2010; State Higher Education Executive Officers Association 2015)—and students are paying more for their education than ever before. Human capitol theory suggests that the investment in higher education pays off in larger lifetime earnings (Toutkoushian and Paulsen 2016). Additionally, the benefits of receiving an education must outweigh the price paid for the education (Toutkoushian and Paulsen 2016). To deal with increases in tuition prices, students are now taking out large amounts of student loans to afford attending college. In 2016, the median amount of student loan debt for individuals with a bachelor’s degree was $25,000 (Cilluffo 2017). Moreover, about 20 percent of bachelor’s degree holders, between the ages of 25 to 39, with student loan debt, held a second job and reported financial difficulty, compared with 11 percent of individuals without student loan debt (Cilluffo 2017). The same report also found that about half of bachelor’s degree holders, between the ages of 25 and 39, with student loan debt believed the lifetime financial benefits of their degree outweighed its price, and about 70 percent of graduates without debt believed the benefits outweighed the price (Cilluffo 2017).
Human capitol theory suggests that the investment in higher education pays off in larger lifetime earnings (Toutkoushian and Paulsen 2016).
These data presented within the current study have several limitations. Institutions that receive federal student aid are required by law to provide data to IPEDS per the Higher Education Act of 1965, as amended (U.S. Department of Education, National Center for Education Statistics 2016). Data from IPEDS is publicly available and is the most comprehensive source of aggregate data for education in the United States. However, due to changes in federal accounting standards in 2000 and subsequent changes in the IPEDS reporting categories, the study authors were unable to replicate the AE&G formula used in prior studies, creating limitations for comparing results from the current study with prior studies. Additionally, two different accounting standards, the Governmental Accounting Standards Board (GASB) and Financial Accounting Standards Board (FASB), are used in reporting financial information to IPEDS, and the different accounting methods may create inconsistencies in reporting categories. However, the degree to which these inconsistencies exist is unknown.
As the price of a college education continues to increase, the question arises of whether human capital will continue to play a part in college choice. Enrollment continued to rise during the study period under review (even though tuition increased), leading the authors to believe that students still believe the benefits of a college education outweigh the price. It may also mean that college is perceived as a necessity rather than an investment, driving students to get an education based on intangible benefits rather than financial return on its investment. Given that individuals and families have a larger share of educational costs, further research may help to understand the perceived value of a college degree. Additionally, determining potential differences in IE by subject areas or departments may also glean insight into the complexities of educational costs.
References
Bowen, Howard Rothman. 1980. The Costs of Higher Education: How Much Do Colleges and Universities Spend Per Student and How Much Should They Spend? The Carnegie Council Series. San Francisco: Jossey-Bass Publishers.
Brinkman, Paul T. 2000. The Economics of Higher Education: Focus on Cost, New Directions for Institutional Research 2000 (106): 5–13.
Bureau of Labor Statistics. n.d. CPI Inflation Calculator. Databases, Tables, and Calculators by Subject. Accessed July 2, 2018. https://www.bls.gov/data/inflation_calculator.htm.
Cilluffo, Anthony. 2017. 5 Facts about Student Loans, Pew Research Center (blog). August 24, 2017. http://www.pewresearch.org/fact-tank/2017/08/24/5-facts-about-student-loans/.
Getz, Malcolm, and John J. Siegfried. 1991. Costs and Productivity in American Colleges and Universities, In Economic Challenges in Higher Education, by Charles T. Clotfelter, Ronald G. Ehrenberg, Malcolm Getz, and John J. Siegfried. A National Bureau of Economic Research Monograph. Chicago: University of Chicago Press.
Harter, John F. R., John A. Wade, and Thomas G. Watkins. 2005. An Examination of Costs at Four-Year Public Colleges and Universities Between 1989 and 1998, The Review of Higher Education 28 (March): 369–91. https://doi.org/10.1353/rhe.2005.0011.
Harvey, James, Roger M. Williams, Rita J. Kirshstein, Amy Smith O’Malley, and Jane V. Wellman. 1998. Straight Talk about College Costs and Prices. Report of the National Commission on the Cost of Higher Education. Oryx Press. https://eric.ed.gov/?id=ED416762.
McPherson, Peter, and David Shulenburger. 2010. Understanding the Cost of Public Higher Education, Planning for Higher Education 38 (3): 15–24.
National Center for Education Statistics. 2018. Digest of Education Statistics, 2016. https://nces.ed.gov/fastfacts/display.asp?id=76.
National Center for Education Statistics. 2018. Table 605.20. Government and Private Expenditures on Education Institutions as a Percentage of Gross Domestic Product, by Level of Education and Country: Selected Years, 2005 through 2014. Digest of Education Statistics. January 2018. https://nces.ed.gov/programs/digest/d17/tables/dt17_605.20.asp.
Pike, Gary R., George D. Kuh, Alexander C. McCormick, Corinna A. Ethington, and John C. Smart. 2011. If and When Money Matters: The Relationships Among Educational Expenditures, Student Engagement, and Students’ Learning Outcomes. Research in Higher Education 52 (February): 81–106. https://doi.org/10.1007/s11162-010-9183-2.
Pike, Gary R., John C. Smart, George D. Kuh, and John C. Hayek. 2006. Educational Expenditures and Student Engagement: When Does Money Matter? Research in Higher Education 47 (November): 847–72. https://doi.org/10.1007/s11162-006-9018-3.
Ryan, John F. 2004. The Relationship Between Institutional Expenditures and Degree Attainment at Baccalaureate Colleges, Research in Higher Education 45 (March): 97–114. https://doi.org/10.1023/B:RIHE.0000015691.02545.61.
Ryan, John F. 2005. Institutional Expenditures and Student Engagement: A Role for Financial Resources in Enhancing Student Learning and Development? Research in Higher Education 46 (March): 235–49. https://doi.org/10.1007/s11162-004-1601-x.
Smart, John C., Corinna A. Ethington, Robert O. Riggs, and Michael D. Thompson. 2002. Influences of Institutional Expenditure Patterns on the Development of Students’ Leadership Competencies, Research in Higher Education 43 (February): 115–32. https://doi.org/10.1023/A:1013074218134.
State Higher Education Executive Officers Association. 2015. “SHEF: FY 2014.” Boulder, CO: SHEEO. http://www.sheeo.org/projects/shef-fy14.
Toutkoushian, Robert Kevin, and Michael B. Paulsen. 2016. Economics of Higher Education: Background, Concepts, and Applications. Dordrecht: Springer.
U.S. Bureau of Economic Analysis. n.d. Gross Domestic Product [GDPA]. FRED, Federal Reserve Bank of St. Louis. Accessed July 2, 2018. https://fred.stlouisfed.org/series/GDPA.
U.S. Department of Commerce, Bureau of Economic Analysis. n.d. What Is GDP? U.S. Department of Commerce. Accessed July 3, 2018. https://www.bea.gov/newsroom/_pdf/GDP-Education-by-BEA.pdf.
U.S. Department of Education, National Center for Education Statistics. 2016. Media Primer. Publication No. 201747. https://nces.ed.gov/ipeds/.
Webber, Douglas A., and Ronald G. Ehrenberg. 2010. Do Expenditures Other than Instructional Expenditures Affect Graduation and Persistence Rates in American Higher Education? Economics of Education Review 29 (December): 947–58. https://doi.org/10.1016/j.econedurev.2010.04.006.
Wellman, Jane V., Donna M. Desrochers, and Colleen M. Lenihan. 2008. The Growing Imbalance: Recent Trends in U.S. Postsecondary Education Finance. Lumina Foundation for Education. https://eric.ed.gov/?id=ED501221.
Author Biographies
Dawn A. Iwamasa is a doctoral candidate in music education with an emphasis in music therapy at Florida State University College of Music. She holds a bachelor of music and a master of arts from the University of the Pacific.
Michael Thrasher currently serves as associate dean for academic affairs and director of graduate studies at Florida State University College of Music. He holds a bachelor of music education from Northwestern State University, and both a master of music and a doctor of musical arts from the University of North Texas.
- Topics
- Topics
- Integrated Planning
Integrated Planning
- Topics
Topics
- Resources
- Topics